Heap Peek
Heap Peek is a debug feature available at least since LabVIEW 3.0. It allows to view internal data structures created for all loaded VI files, including Front Panel Heap and Block Diagram Heap. The feature is intended for use by LV R&D, though users may in some cases be instructed by LV Support to check something there.
Enabling Heap Peek
The Heap Peek keyboard shortcut is by default disabled in fresh installations of LabVIEW. To enable it:
- Close LabVIEW
- Put the key "LVdebugKeys=True" in your LabVIEW configuration file
Then, to launch the Heap Peek window:
- Open your VI
- Press one of the following key combinations, depending on your situation:
- (LabVIEW 2025 Q1 and earlier) Press Ctrl + Shift + D + H.
- (LabVIEW 2025 Q3 and later) Press Ctrl + Shift + : + H (that's a colon).
- On Mac, use the Cmd key instead of Ctrl.
Using Heap Peek
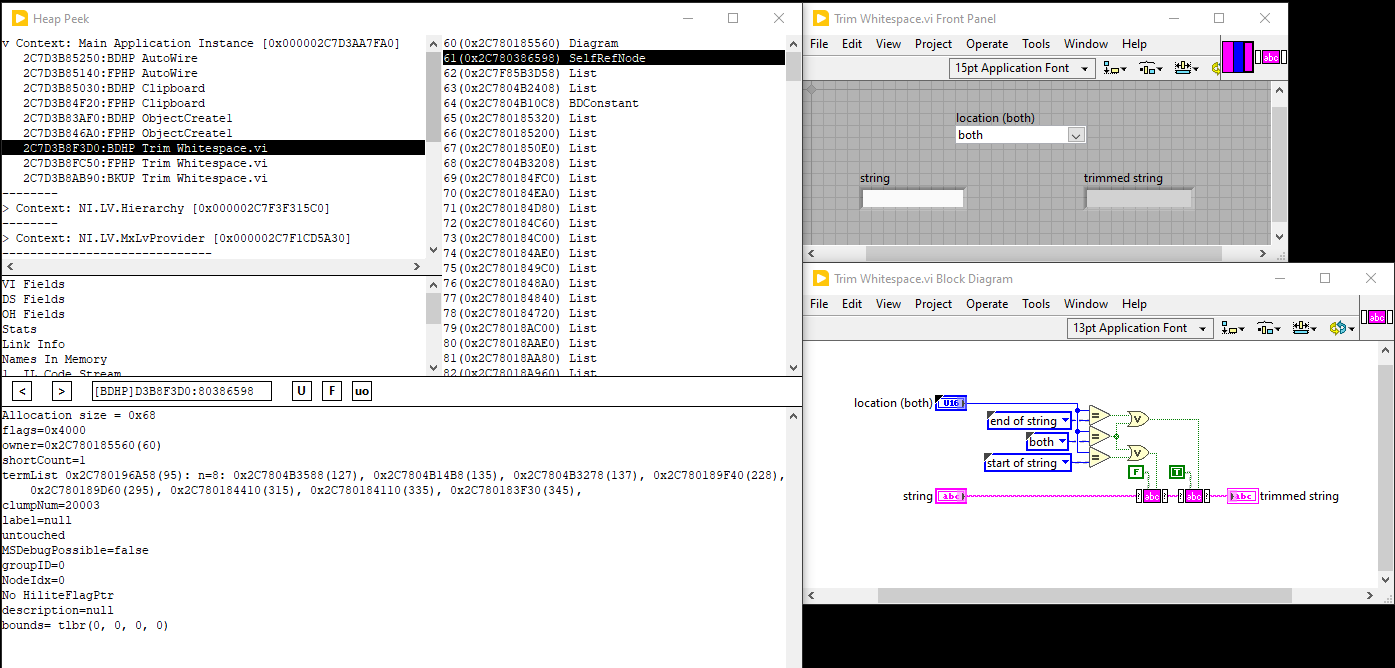
The window is divided into 5 sections:
- Loaded Container Files are in top-left,
- Heap View is top-right,
- Structure selection for info pane in middle-left,
- Toolbar at the middle,
- Information pane is at base.
The first section, as for usage flow, is top-left one. Start there, by left clicking to select the specific file and specific heap you want to look at. When the heap is selected, you can display many details on it by clicking rows of either top-right or middle section. These details will show at base, in Information pane.
Note: Heap Peek only displays information and does not have any ability to change the objects. It does, however, display the locations in memory where the information is stored, which makes it easy to use external memory editing software for this purpose.
Loaded Container Files list
The list is divided into Contexts. In each of these, you can see memory location of the item (within LabVIEW process memory), and entries marked BDHP or FPHP.
- BDHP is Block Diagram Heap
- FPHP is Front Panel Heap
Note: There are VIs in LV that are not real VIs (for example, a pseudo VI that is created to represent a Call By Reference to another application instance on another machine), and attempting to do Find to jump to their components can cause problems because those VIs never expect to actually draw themselves.
Heap View
Heap, for LV, is really a Front Panel or Block Diagram. Despite the name, they don't really have a heap-like structure. Both FP and BD are stored in form of a tree, strongly inspired by XML format. The main difference is - the LV Heap format is binary, not text-based.
In Heap View, Heaps are displayed in a flattened form, not in its full tree-like glory. Part of the entries show properties of the whole pane, and the rest is controls, indicators and other elements added to the pane.
The view for FPHP reveals that controls and indicators are composed of several parts - ie. Numeric controls consist of: Label, Frame, Up/Down buttons, Edit field, Radix and Annex. Each part has partID, which is used by LV to identify type of that part.
Note: To learn more about LV Heaps, consider exporting a few to XML, and looking at them there. The flat list visible in Heap View will be very helpful when you understand them, but it's not the best way to acquire that understanding.
Structure selection
Here you can select one of the structures within VI files other than FPHP/BDHP. These are per-file, not per-heap - so you won't find any difference in them if you select different part of the same file in Loaded Container Files list.
The selectable options are:
- VI Fields - lists values of many common settings and flags of the VI file
- DS Fields - lists Data Space properties, including Table of QEs and Table of TMEs
- OH Fields
- Stats - statistics for objects used within Heaps
- Link Info - content of all LinkObj lists
- Names In Memory
- IL Code Stream - Prints Intermediate Language Code used during code compilation process
- Code Disassembly - Prints assembly generated by the compiler for given VI file
- Transform Metrics
- UDClass Info
- Full OMUDClassPtr List
- Available Implementers
DS Fields
Data Space in an important concept in LV internals. In short, Data Space contains filling for all type mapped data types. Be sure to read more on Data Space to understand it better.
The DS Fields section contains some general information on Data Space of the file, and then displays whole mapping of the Data Space (DSTM). As of LV2014 it doesn't show values stored in data space, but it shows offsets within said Data Space, and Type Map Entries (TMEs) with information about which data type is stored there, with all its properties. The DSTM data in this section is cut to only show part of Data Space which is used for different purposes than Heap - the complete Data Space is always larger.
Toolbar
The toolbar consists of several fields.
- Next/prev buttons
- Currently selected item name text
- U button
- F button - Click on it to find the object selected in Heap View. LabVIEW will switch to the block diagram or front panel and select related object.
- uo button - Toggles between sorting the list on the right by UID (the default) or by memory address.
Note: A previous author said that few developers really know the capacities of heap peek. This is true... it's a debugging tool, and it gets hacked up to debug whatever anyone needs to debug.

