Buffer Allocation
LabVIEW uses various techniques[1] to optimize code as much as possible. One of those features is the optimization of buffer allocations, which avoids making copies of data in memory if they can be avoided. This is especially useful for large datasets like arrays and clusters, which - by nature - have a high memory footprint. However, sometimes code gets too complex or is written in a way that makes it hard for the compiler to perform optimizations[2][3]. For those cases, some optimizations are skipped and less efficient code gets compiled. This can result in data being copied in the final application and LabVIEW running "out of memory".
A programmer that is aware of such limitations can write their code accordingly, which is why LabVIEW provides an utility to visualize buffer allocations in the code.
Show buffer allocations
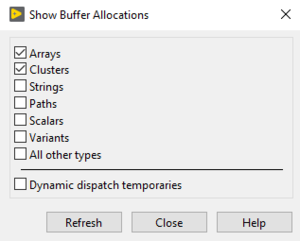
Since LabVIEW 7.1, there is a built-in utility that visualizes buffer allocations on the block diagram. When enabled, black dots indicate buffer allocations. These can be shown for specific or all types. By default only Arrays and Clusters are shown, because those two types typically have the greatest impact on memory consumption.
| Type | Description |
|---|---|
| Shows buffer allocations for arrays. | |
| Shows buffer allocations for clusters. | |
| Shows buffer allocations for strings. | |
| Shows buffer allocations for paths. | |
| Shows buffer allocations for scalars. | |
| Shows buffer allocations for variants. | |
| Shows buffer allocations for any other type not mentioned above. | |
| Shows temporary buffer allocations for dynamic dispatch VIs. These buffer allocations are temporary because a buffer allocation might or might not happen depending on the descendant. |
Uncritical buffer allocations
Buffer allocations are shown for the code that was written by the programmer, not for the code after it was optimized by the compiler. This means that some buffer allocations are not as critical as they appear to be at first glance.
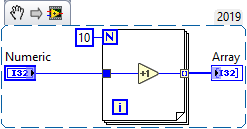
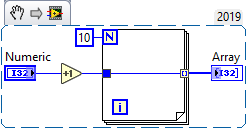
Constants and constant expressions inside loops
Constants and constant expressions inside loops are initialized once and re-used for each iteration. The buffer allocation dot only indicates that the value in-fact requires a buffer being allocated for it. It doesn't mean that the buffer is re-allocated on every iteration of the loop. The compiler will instead "move" the code outside the loop. This process is called Loop-Invariant Code Motion[1].
 |
 |
Indexing tunnels on loops
Buffer allocations for indexing tunnels of for and while loops behave differently.
For loops execute code a specific number of times. This means that the maximum buffer size can be determined by multiplying the number of iterations with the size of one element. While loops, on the other hand, execute an arbitrary number of times which means that the buffer is allocated once and re-sized dynamically if more space is required[4].
Controls
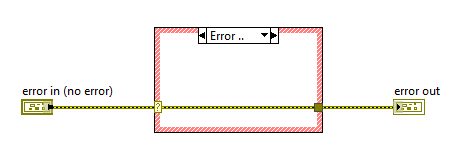
Controls are displayed as buffer allocations, which isn't necessarily true if the VI is used as a subVI. Depending on the code, values may even pass through a VI without any buffer allocations. A very common example for this are the error in/out terminals.
Controversy: "Copy dots" vs. "Buffer allocations"
The following section is based on a post by Aristos Queue on LAVA[5].
Some people call buffer allocations "copy dots" because they believe these indicate where LabVIEW is making a copy of the data. About 90% of the time, that is accurate. But there are some cases where a "buffer allocation" and a "copy" are not the same thing at all.
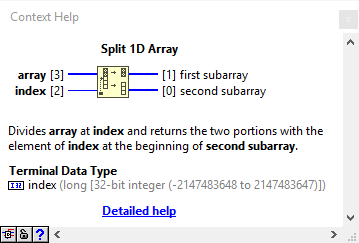
When using arrays, one of the major times when buffer allocations are of interest to programmers, not all buffer allocations are copy dots. Whenever possible, LabVIEW will do an operation on an array by creating a "subarray". In the Context Help window these wires are displayed as "subarray" type.
A subarray is simply a reference to another array, storing an index into that array and a stride and a length. This is a very efficient way to do some pretty complex operations without actually allocating new arrays, such as Decimate Array, Split Array, and Reverse Array. In fact, Reverse Array returns an index to the last element of the array and a stride length of -1.
The return of a subarray is only possible when LabVIEW is certain that no other operation will modify the value of the array, so it is safe for the reference to the array in memory to be shared.
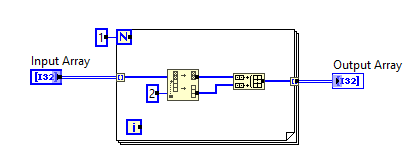
Notice the buffer allocations in the following diagram:
The Split 1D Array node has two output buffer allocations. These buffer allocations are for the subarrays, which record a reference to the array, a starting index, a length and a stride. Those four items have to be stored somewhere. The buffer allocations are for those four items. It is not a copy of the entire array.
The output of the Build Array, on the other hand, is a full array allocation.
To see what kind of array is being allocated, look at the type of the wire using the Context Help window.
Best practice
- Use the Show Buffer Allocations dialog to analyze buffer allocations of memory-critical code.
- Add elements to the end of arrays, not at the front.
- Use the Reverse Array function to add elements at the front of arrays.
- Don't optimize buffer allocations for subarrays.
History
| |
Which version added the "Dynamic dispatch temporaries" option? 8.6 didn't have it, 2015 has it. |
| Version | Change(s) |
|---|---|

|
Moved the utility to Tools >> Profile >> Show Buffer Allocations... |

|
Added the ability to show where buffer allocations occur in the code (Tools >> Advanced) |
See also
External links
- How does LabVIEW allocate a new buffer? (National Instruments Knowledge Base Article)
- Memory Is Full Error in LabVIEW (National Instruments Knowledge Base Article)
References
- ↑ 1.0 1.1 LabVIEW Compiler: Under the Hood (National Instruments Tutorials)
- ↑ Choosing between Editor Responsiveness and VI Execution Speed (LabVIEW 2018 Help)
- ↑ Understanding code complexity (National Instruments Forums)
- ↑ Memory benefits using conditional For Loop (National Instruments Forums)
- ↑ Another reason why "copy dots" is a bad name for "buffer allocations" (LAVA Topic)

