Block Diagram: Difference between revisions
mNo edit summary |
mNo edit summary |
||
| Line 26: | Line 26: | ||
=== Constants === | === Constants === | ||
'''[[Constant]]s''' are unchanging pieces of data on the Block Diagram. Constants can be any [[Data types|data type]]. It is best practice to label constants to help programmers reading the code understand why the constant is there. | '''[[Constant]]s''' are unchanging pieces of data on the Block Diagram. Constants can be any [[:Category:Data types|data type]]. It is best practice to label constants to help programmers reading the code understand why the constant is there. | ||
=== Wires === | === Wires === | ||
Revision as of 13:44, 12 May 2020
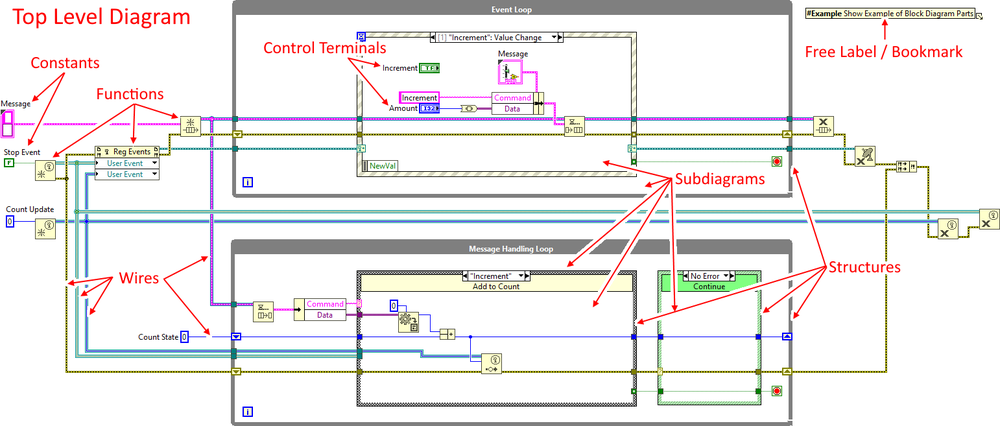
The Block Diagram is the part of a VI that contains the graphical source code known as G. Front Panel controls and indicators appear on the Block Diagram as control terminals. The control terminals for the Front Panel controls are the input where the Front Panel indicators are the output. Wires connect the terminals to other Nodes and each other to flow the data between them similar to a flow chart (see Dataflow). Operational order is dictated by Dataflow. Parts that are not connected are automatically parallelized by the compiler to take advantage of parallel processing that is available in modern multi-core computers.
Parts of a Block Diagram

Top Level Diagram
All of the code exists in the Top Level Diagram of the Block Diagram.
Control Terminals
Control Terminals are the representation of the Front Panel controls and indicators on the Block Diagram.
Nodes
Nodes are all the function blocks and structures on the Block Diagram.
Structures
Structures such as Case Structures, Event Structures, For Loops, and While Loops, etc. contain subdiagrams with more code in them. This code runs under the conditions of the structure its in. For example, the code contained in a loop runs until the conditions of the loop are met to finish.
A Case Structures has multiple subdiagrams. The input to the Case Structure has values that correspond to a case (one of these subdiagrams). Depending on the input selector the proper code in a subdiagram runs.
Functions
Functions are the elements that act on the data. They can carry out simple operations such as math operations (add, subtract, multiply, and divide), or more complex operations such as creating or destroying a queue reference or establishing TCP communication.
SubVIs
SubVIs are subroutines where one VI can call another. This is accomplished by connecting controls and indicators to a VI's Connector Pane, dropping that VI on a Block Diagram of another VI and then attaching Wires to these inputs and outputs. There really is no difference between a VI and a SubVI.
Constants
Constants are unchanging pieces of data on the Block Diagram. Constants can be any data type. It is best practice to label constants to help programmers reading the code understand why the constant is there.
Wires
Wires are the mechanism that transfers data from one node to another (see Dataflow).
Decorations
Decorations are cosmetic elements that do not affect the operation of the code. Some decorations, such as Free Labels serve as in-code documentation.
Free Labels
Free Labels serve as in-code documentation. They can be free floating or attached by arrow to specific nodes. Free label that contain a hashtag (#) are known as Bookmarks and can be found throughout the Project using the Bookmark Manager.
Best Practices
Code Organization
- Organize code to flow from Left-to-Right, Top-to-Bottom. Keep all input control terminals on the left and all output control terminals on the right.
- Do not place control terminals inside of Case Structures.
Code Size
If possible keep all code on a Block Diagram viewable on the screen without scrolling. Use SubVIs, Design patterns, etc. to organizes and enable code reuse. If necessary to scroll, only scroll in one direction, either Left and Right OR Up and Down.
Documentation
- When providing in-code documentation, document the Why's rather than the What's. If code is written well, what the code does should be easy to read. The documentation should help programmers viewing the code understand the original programmers reasoning and intent.
- Add documentation at the appropriate level. Documentation can be added to the VIs, Nodes, Wires, Subdiagrams, Constants and as Free Labels on the Block Diagram.
Design Patterns
Use commonly used Design patterns to standardize code organization among programmers.
