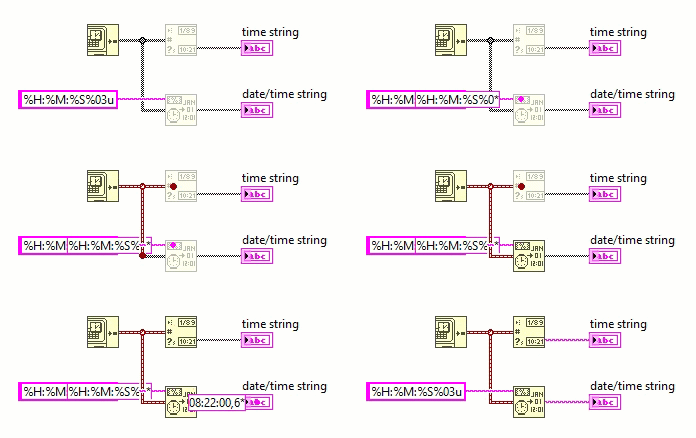
Execution highlighting

Execution highlighting is a debugging feature in LabVIEW that allows users to observe data flow as a VI runs. It adds a visual marker to highlight data flow, reduces the speed at which code executes and forces parallel code to run sequentially in a single thread.
Since parallel code runs sequentially, execution highlighting cannot be used to debug concurrency issues or race conditions. The execution order of parallel code is also not deterministic as the order in which they are executed can change between runs.[1]
Execution highlighting can be toggled through the Highlight Execution ![]() / Do Not Highlight Execution
/ Do Not Highlight Execution ![]() button in the Block Diagram window of a VI. It can be enabled before a VI runs, while a VI runs, or when a breakpoint is reached. Execution highlighting will continue for the rest of the VI or until it is disabled.
button in the Block Diagram window of a VI. It can be enabled before a VI runs, while a VI runs, or when a breakpoint is reached. Execution highlighting will continue for the rest of the VI or until it is disabled.
VI Scripting
Using VI Scripting, execution highlighting can be controlled through the Highlight Execution? property of the TopLevelDiagram class.
Custom probe
LabVIEW 2019 added the Toggle Execution Highlighting custom probe that toggles execution highlighting when the execution flow reaches the probe.
