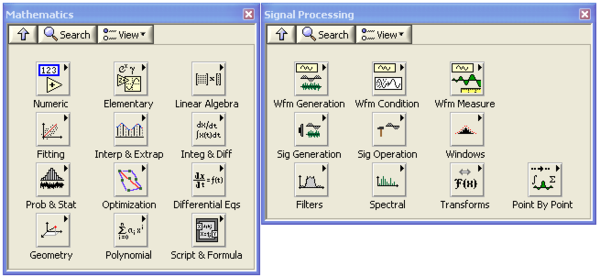
Math and Signal Processing
| |
This article is a stub. You can help LabVIEW Wiki by expanding it. Please improve this article if you can. |
| |
This article or section needs to be wikified to meet LabVIEW Wiki's quality standards. Please help improve this article with relevant internal links. |
LabVIEW Full/Professional Development System has more than 600 VIs for mathematics and signal processing. In addition, there are about ten add-on LabVIEW toolkits/modules for math and signal processing. The LabVIEW analysis tools cover many mathematics and signal processing fields such as linear algebra, polynomials, curve fitting, statistics, optimization, joint time-frequency analysis, time series analysis, wavelet analysis, digital filter design, system identification, image processing, etc.
Overview
The mathematics and signal processing VIs in LabVIEW can be divided into these categories:
- Mathematics: linear algebra, polynomials, curve fitting, interpolation, optimization, etc.
- Basic Signal Processing: windowing, filtering, transforms, etc.
- Advanced Signal Processing: time-frequency analysis, time series analysis, wavelet, filter design, and system identification.
- Measurement Analysis: sound and vibration level measurement, order analysis, frequency measurement.
- Communication: modulation and demodulation
- Vision and image processing
The mathematics and basic signal processing VIs are built-in functions of LabVIEW Full/Professional Development System. The other functions are of add-on toolkits or modules.
Built-in Functions
LabVIEW Full/Professional Development System includes more than 500 mathematics and signal processing functions. You can find these functions under the Mathematics palette and Signal Processing palette.

Toolkits/Modules Introduction
Advanced Signal Processing Toolkit Digital Signal Processing Toolkit ...
Function List
Tutorials
Basic Signal Processing
- The Fundamentals of FFT-Based Signal Analysis and Measurement in LabVIEW and LabWindows/CVI
- FFT Interactive Tutorial
