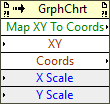
GraphChart class/Map XY To Coordinates method
Appearance
| VI Server Method Information | |
|---|---|
| Method ID | 6341801 |
| Scope | Basic Development Environment |
| Data Name | Map XY To Coords |
| Short Name* | Map XY To Coords |
| Long Name* | Map XY To Coordinates |
| * Displayed here in English. Short and Long names appear in the language of the LabVIEW IDE. | |
| Owning Class ID | 22 |
| Owning Class Name | GraphChart Class |
| Return Data Type | Boolean data type |
| Invoke Node | 
|
| Available in Real-Time Operating System | Yes |
| Available in Run-Time Engine | Yes (Read/Write) |
| Loads the block diagram into memory | No |
| Loads the front panel into memory | Yes |
| Need to authenticate before use | No |
| Remote access allowed | Yes |
| Settable when the VI is running | Yes |
Returns TRUE and maps the XY location on a graph to the owning pane coordinates. If you do not specify the scales, LabVIEW uses the active or current scales. This method is useful when you need to map graph coordinates to plot image coordinates to draw images inside the plot area of a graph.
This method adjusts only the left and top plot bounds to orient the plot around the origin of the owning pane.
Parameters
Uses
| |
Specific use cases for this method. |
History
| |
History information is needed. What changes have occurred over previous versions? |
| Version | Change(s) |
|---|---|

|
More info to come. |
See Also
| |
Add links to internal wiki pages that would also help. |
External Links
| |
Add links to external resources that would also help. |
