Converting a Sensor Voltage Input to Physical Units
Regardless of the type of input sensor you are using, the signal to the DAQ card will always be a voltage. This voltage represents the physical phenomenon you want to record and display on your LabVIEW screen. We cannot use this voltage directly since it is confusing and cannot be easily understood. We must convert this to a real world value.
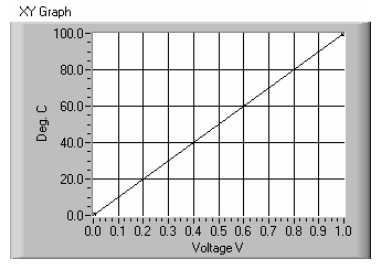
For example, if we are using a temperature sensor that gives us 0V to 1V that represents 0C to 100C temperature. If we were to graph this it would look like this:
As you can see the calibration for this sensor looks like a straight line. With this line we can convert any voltage value to temperature. This straight line is represented by the formula: F=m*x+B where:
- F=Desired engineering value
- m=slope
- x=voltage from sensor
- B=offset
For example: 0.234V will give us 100*0.234+0 = 23.4C
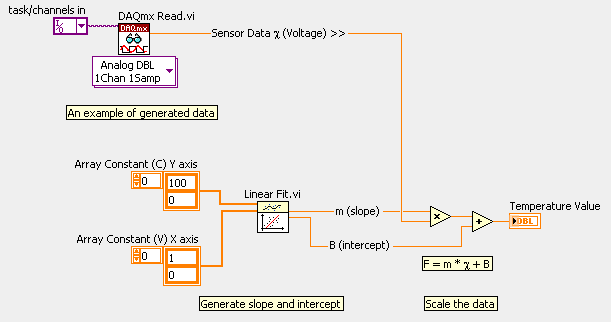
We can easily do this in LabVIEW as well to convert your voltage readback to physical units as seen below:
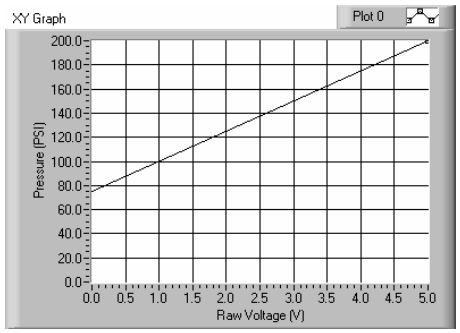
In the above LabVIEW example we can easily replace the Temperature range with anything else like pressure (–50 to 200 PSI) and the Voltage range with (–5 to 5V). This will give us the following calibration graph:
As we can see our line crosses the 0V line at about 75PSI this means we have an offset B=75. This will be handled automatically with the Linear Fit vi. So a value of 1Volt will give us 100PSI. Go ahead, try this in LabVIEW. If you don’t have hardware just wire a constant numeric value for x.
We must note that this method will work with most sensors because they are very linear however there are some sensors that are not linear. This means a straight line cannot represent their characteristic. When working with non-linear sensors we must use a different method such as a table of values or a polynomial fit.


