Data flow: Difference between revisions
Leahmedwards (talk | contribs) m Fixed broken link to Wikipedia article on Dataflow programming |
Change links to point to execution highlighting, remove notice about single thread |
||
| Line 15: | Line 15: | ||
{| | {| | ||
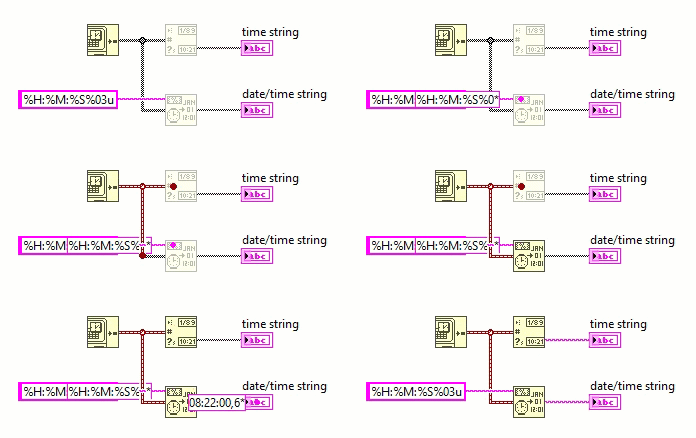
| [[File:Dataflow - Nodes execute in parallel.gif|frame|Nodes without data dependencies execute in parallel. (Note: [[ | | [[File:Dataflow - Nodes execute in parallel.gif|frame|Nodes without data dependencies execute in parallel. (Note: [[Execution highlighting]] forces the code to run in a single thread which is why they appear to execute sequentially).]] | ||
|} | |} | ||
== Visualizing dataflow in LabVIEW == | == Visualizing dataflow in LabVIEW == | ||
[[Execution highlighting]] can be used to visualize the flow of data while executing a [[VI]] in LabVIEW. | |||
== See also == | == See also == | ||
Latest revision as of 16:33, 6 May 2023
Dataflow programming is a programming paradigm where the execution of functions is determined by their data dependencies. This is fundamentally different from traditional programming paradigms that execute functions in sequence as they appear in the source code.
LabVIEW dataflow model
LabVIEW uses the graphical programming language G Dataflow, which utilizes wires to represent data dependencies between functions (nodes in LabVIEW terminology).
A node without input wires can execute immediately, while a node with input wires must wait until the previous node has finished execution.
 |
 |
It is also possible to execute multiple nodes in parallel, as long as they have no data dependencies between each other. However, the total number of nodes that can execute in parallel is limited by the execution system.
 |
Visualizing dataflow in LabVIEW
Execution highlighting can be used to visualize the flow of data while executing a VI in LabVIEW.
See also
External links
- Wikipedia:Dataflow programming (Wikipedia)
- Dataflow Programming Basics (National Instruments)
