Default Error Code: Difference between revisions
Appearance
Creating the Default Error Codes page |
Added Link to new page |
||
| (2 intermediate revisions by the same user not shown) | |||
| Line 1: | Line 1: | ||
[[File:Explain Error Dialog.png|thumb|Explain Error Dialog]] | [[File:Explain Error Dialog.png|thumb|Explain Error Dialog]] | ||
'''Default Error Codes''' are the built-in error codes in the LabVIEW execution system, (see [[Error List]]). These error codes encourage standardization and reuse of generic codes across applications. the definition of all errors codes can be found in the LabVIEW Help. Another method of finding the default error code is by select the '''Help-->Explain Error''' menu item. This will launch an interface that allows the user to enter an error code, and a brief explanation is displayed. This interface is also accessible by right-clicking on a front panel error cluster, and selecting '''Explain Error'''. | |||
[[Category:Error Handling]] | [[Category:Error Handling]] | ||
Latest revision as of 13:34, 28 September 2021

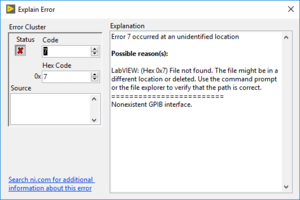
Default Error Codes are the built-in error codes in the LabVIEW execution system, (see Error List). These error codes encourage standardization and reuse of generic codes across applications. the definition of all errors codes can be found in the LabVIEW Help. Another method of finding the default error code is by select the Help-->Explain Error menu item. This will launch an interface that allows the user to enter an error code, and a brief explanation is displayed. This interface is also accessible by right-clicking on a front panel error cluster, and selecting Explain Error.
