Probe Watch Window: Difference between revisions
Appearance
Add page content, remove stub label |
m Correct wikilink to Breakpoint Manager |
||
| Line 9: | Line 9: | ||
==History== | ==History== | ||
{{history|product=LabVIEW|2025 Q3| | {{history|product=LabVIEW|2025 Q3| | ||
* Combined Breakpoint Manager and | * Combined [[Breakpoint Manager]] and Probe Watch Window into [[Debug Window]] | ||
}} | }} | ||
Latest revision as of 08:37, 17 August 2025

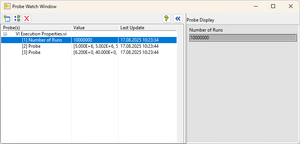
Probe Watch Window is a tool that displays the status and values of all probes and custom probes in the application context. In LabVIEW 2025 Q3, Probe Watch Window was combined with Breakpoint Manager into Debug Window.
Usage
Probe Watch Window appears automatically when the first probe is placed. It can also be opened through the View menu under Probe Watch Window.
It shows a list of probes and corresponding values from the last update. The values are updated live while a VI executes. When a probe is selected, the probe display area shows the probe value in a matching control. Custom probes can be used to provide different visualization and conditional behavior.
History
- LabVIEW 2025 Q3:
- Combined Breakpoint Manager and Probe Watch Window into Debug Window
