Breakpoint Manager: Difference between revisions
Appearance
Started as {{stub}} |
Add page content, remove stub label |
||
| Line 1: | Line 1: | ||
{{ | [[File:Breakpoint Manager.png|thumb|Breakpoint Manager]] | ||
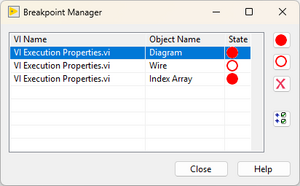
'''Breakpoint Manager''' is a tools that displays and controls all [[breakpoint]]s in the application context. In [[LabVIEW 2025 Q3]], Breakpoint Manager was combined with [[Probe Watch Window]] into [[Debug Window]]. | |||
==Usage== | |||
Breakpoint Manager can be accessed from the ''View'' menu under ''Breakpoint Manager'' or by using the shortcut menu option ''Breakpoint'' >> ''Breakpoint Manager'' on any breakpoint on the [[Block Diagram]]. | |||
It displays the list of breakpoints in the current application context and provides controls to enable, disable, or remove breakpoints. Different icons indicate whether a breakpoint is enabled (filled) or disabled (circle). Double-clicking an entry in the list highlights the corresponding breakpoint in a VI. | |||
==History== | |||
{{history|product=LabVIEW|2025 Q3| | |||
* Combined Breakpoint Manager and [[Probe Watch Window]] into [[Debug Window]] | |||
}} | |||
==See also== | |||
* [[Breakpoint]] | |||
* [[Debug Window]] | |||
[[Category:Development Environment]] | [[Category:Development Environment]] | ||
[[Category:Debugging]] | |||
Revision as of 08:20, 17 August 2025

Breakpoint Manager is a tools that displays and controls all breakpoints in the application context. In LabVIEW 2025 Q3, Breakpoint Manager was combined with Probe Watch Window into Debug Window.
Usage
Breakpoint Manager can be accessed from the View menu under Breakpoint Manager or by using the shortcut menu option Breakpoint >> Breakpoint Manager on any breakpoint on the Block Diagram.
It displays the list of breakpoints in the current application context and provides controls to enable, disable, or remove breakpoints. Different icons indicate whether a breakpoint is enabled (filled) or disabled (circle). Double-clicking an entry in the list highlights the corresponding breakpoint in a VI.
History
- LabVIEW 2025 Q3:
- Combined Breakpoint Manager and Probe Watch Window into Debug Window
